
An eventful first quarter wrapped up last week. In today’s blog, we make seven market observations from first quarter performance and share our thoughts on what these performance trends could mean for our outlook.
§ Growth Dominated Value
Growth soundly beat value on technology’s strength, with an additional boost from consumer discretionary outperformance and financials underperformance (based on the Russell 1000 style indexes). Lower interest rates and lower inflation supported the growth style. LPL Research has reduced its value tilt and now recommends a roughly balanced approach to style.
Looking ahead, the key question is whether the macroeconomic environment will remain supportive for growth stocks. We’re in no rush to declare the value run is over, but with more evidence this week of easing inflation pressures (soft ISM manufacturing, dip in ISM prices paid (<50), fewer job openings in the JOLTS report, ADP jobs shortfall, etc.), macro conditions are moving in the direction of growth stocks despite premium valuations.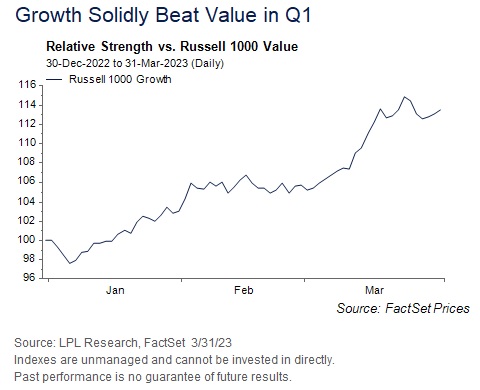
§ The Return of Tech
After a nearly 30% decline in 2022, technology has come storming back in early 2023. LPL Research has upgraded the sector to neutral, partly in response to recent technical strength. Nothing about technology’s fundamentals points to outperformance. Earnings growth doesn’t stand out, nor do estimate revisions. Even valuations look a bit stretched at a more than 35% premium to the S&P 500 on a forward price-to-earnings ratio (P/E) basis. But the sector is clearly in favor right now, our technical analysis work is pointing to further potential gains ahead, and macroeconomic conditions are becoming more favorable for growth stocks, as we noted above.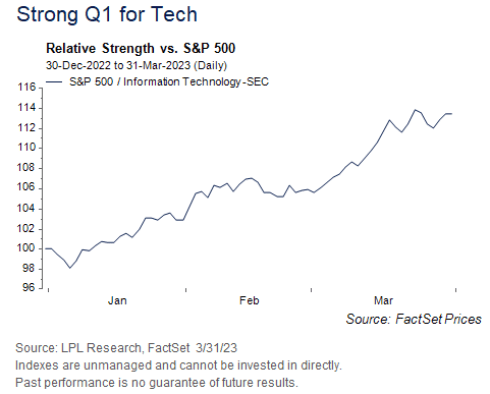
Communication services was the second-best performing sector in the quarter with its 20.2% gain. Communication services, with its greater than 50% weighting in digital media, has benefited from more spending discipline among its top constituents, which helped buoy profit margin expectations and lift earnings estimates. The sector’s social media heavy names also got a boost from the possibility of a TikTok ban.
§ Concentrated Leadership
The biggest individual stock contributors to the S&P 500’s solid first quarter gain were Apple (AAPL), Microsoft (MSFT), NVIDIA (NVDA), Tesla (TSLA), Meta/Facebook (META), Alphabet/Google (GOOG/GOOGL), Amazon (AMZN), Salesforce (CRM), AMD (AMD) and Broadcom (AVGO). Those companies, which are all technology-oriented, drove 88% of the S&P 500’s first quarter gain, which has sparked questions about whether this market is too top-heavy. Narrow leadership, in general, reflects a less healthy rally than one with broader participation. Importantly, about 60% of S&P 500 stocks are trading above their 200-day moving averages, suggesting healthy breadth. Bottom line, breadth should not be a concern at this point.
§ Last Year’s Losers Became This Year’s Winners
Technology underperformed by quite a bit last year before turning around in a big way in 2023. But the trend of last year’s losers becoming this year’s winners, and vice versa, is much broader. If we categorize stocks into quintiles based on 2022 price returns, as shown in the chart below, we see the quintile of the worst performing stocks in 2022 have meaningfully outperformed with a 7.9% first quarter gain, compared with the 2.2% decline for the quintile of the best 2022 performers.
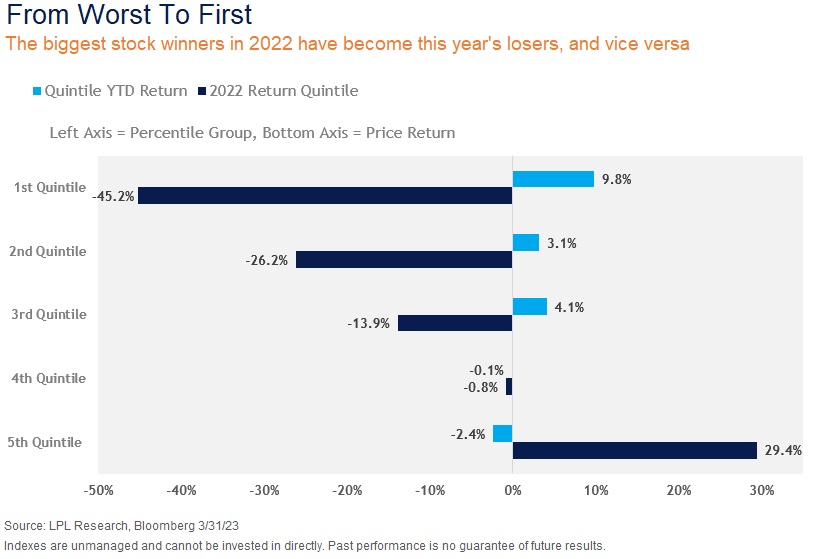
Now the key question is will these oversold bounces turn into sustainable rallies. LPL Research sees enough of a possibility of that occurring that the Strategic and Tactical Asset Allocation Committee (STAAC) has upgraded the communication services and technology sectors (2022 losers), and downgraded energy and healthcare (2022 winners), bringing all four sectors to neutral. The team’s top sector pick is industrials.
§ Small Caps Worked…Until They Didn’t
Bank stress in financials weighed on small caps in March, but for the quarter, strength in large cap technology was actually the biggest contributor to large cap outperformance. The Russell 2000 small cap benchmark returned 2.7% in the first quarter, compared to the more than 7% advance for the large cap S&P 500 and Russell 1000 indexes. Small caps tend to underperform large caps when banks underperform because of the bigger weighting in that segment of the financials sector. But more broadly, small caps often struggle with tightening financial conditions, which is indeed what we have seen since the bank failures about four weeks ago.
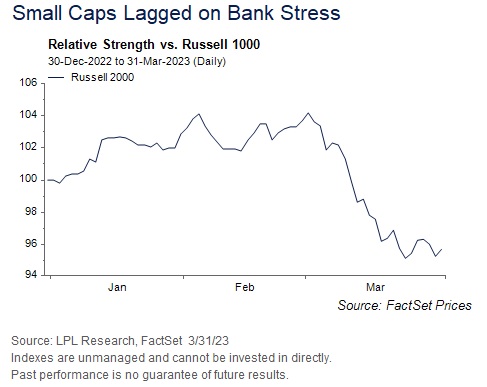
LPL Research’s STAAC has downgraded small caps to neutral due primarily to the technical deterioration evident in the charts. As markets continue to debate if another shoe must drop and how much more work the Federal Reserve (Fed) has to do to combat inflation, the macroeconomic environment may be more supportive for large caps. This may be a short-term stay on the sidelines because of how attractive small cap valuations are currently, particularly profitable, “high quality” small caps.
§ Financials Drag
It’s not a surprise that the banking crisis weighed on financials stocks, to the point of trimming 0.45 percentage points off of the S&P 500‘s first quarter return. What might be a surprise is that healthcare was a bigger drag (-0.65 percentage points), but technology’s more than 5 percentage point contribution more than offset the drags from all of the other sectors. The biggest quarterly declines came from energy, financials, and healthcare.
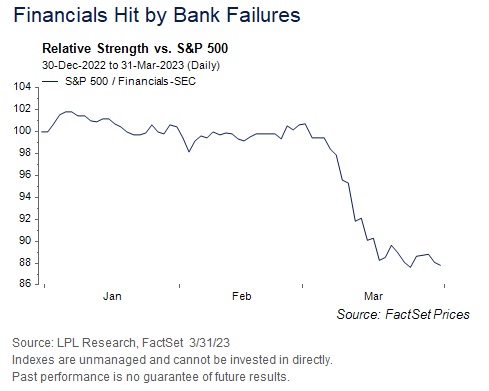
The STAAC is maintaining a neutral view of the sector, as attractive valuations and the backstops by the Fed and Treasury Department appear to have contained the crisis for now. However, the Committee recognizes the pressure on bank profits from the difficult yield curve environment and higher deposit costs. Meanwhile, more regulations are likely coming that might make banks look more like utilities.
§ Developed Markets Continue to Outpace Their Emerging Brethren
One of the biggest stories not just of the first quarter but of late 2022 has been the resilience of European markets. France and Germany have been the biggest drivers of MSCI EAFE Index gains this year, while losses in India and modest gains in China drove most of the MSCI Emerging Markets underperformance. During the first quarter, the MSCI EAFE Index gained 7.6% (8.7% total return), slightly outpacing the large cap U.S. benchmarks. Meanwhile, the MSCI Emerging Markets (EM) Index gained a respectable 3.5% (4% total return), but fell well short of its developed market competition.
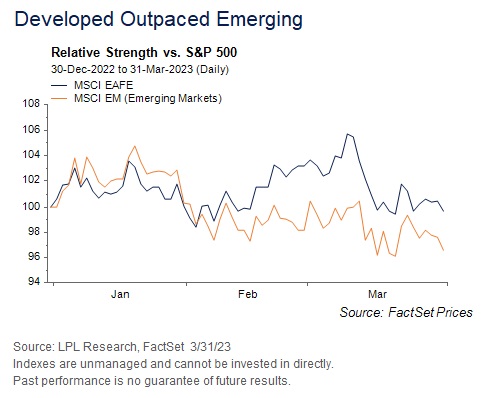
The STAAC continues to favor developed international markets over EM. Valuations are similar, but fundamentals and valuations tilt the scales in favor of developed. Europe’s economic resilience remains impressive. When comparing U.S. equities to developed international, the Committee still gives the U.S. a slight nod. As long as growth stocks are working, it will be difficult for international markets to outperform, despite more attractive valuations.
IMPORTANT DISCLOSURES
This material is for general information only and is not intended to provide specific advice or recommendations for any individual. There is no assurance that the views or strategies discussed are suitable for all investors or will yield positive outcomes. Investing involves risks including possible loss of principal. Any economic forecasts set forth may not develop as predicted and are subject to change.
References to markets, asset classes, and sectors are generally regarding the corresponding market index. Indexes are unmanaged statistical composites and cannot be invested into directly. Index performance is not indicative of the performance of any investment and do not reflect fees, expenses, or sales charges. All performance referenced is historical and is no guarantee of future results.
Any company names noted herein are for educational purposes only and not an indication of trading intent or a solicitation of their products or services. LPL Financial doesn’t provide research on individual equities. All information is believed to be from reliable sources; however, LPL Financial makes no representation as to its completeness or accuracy.
All index and market data from Bloomberg.
This Research material was prepared by LPL Financial, LLC.
Securities and advisory services offered through LPL Financial (LPL), a registered investment advisor and broker-dealer (member FINRA/SIPC).
Insurance products are offered through LPL or its licensed affiliates. To the extent you are receiving investment advice from a separately registered independent investment advisor that is not an LPL affiliate, please note LPL makes no representation with respect to such entity.
§ Not Insured by FDIC/NCUA or Any Other Government Agency
§ Not Bank/Credit Union Guaranteed
§ Not Bank/Credit Union Deposits or Obligations
§ May Lose Value